Warning: Undefined variable $num in /home/shroutdo/public_html/courses/wp-content/plugins/single-categories/single_categories.php on line 126
Warning: Undefined variable $posts_num in /home/shroutdo/public_html/courses/wp-content/plugins/single-categories/single_categories.php on line 127
This exercise riffs on one prepared by the folks at The Programming Historian. For a deep read, work through their complete exercise.
OpenRefine is a tool that is used to make data systematic, to rid a dataset of duplicates, guard against typos and make sure that the same terminology is being used across all metadata categories. It is an Interactive Data Transformation tool (also known as IDT) that allows the large-scale editing of datasets.
Step 1: Download OpenRefine and follow the installation instructions (or go to the digital history lab during DH office hours – Tuesdays from 10 to 1). OpenRefine opens in your browser, but all of the data is stored locally. This means that you can use OpenRefine when you are not connected to the internet, but it also means that if you start working on data on one computer, it won’t transfer over to another computer. Download and save copies of your data often. If you are working on a collaborative dataset, make sure that you are clear on who is working on the data – two people working on the same dataset simultaneously will result in two (different) copies
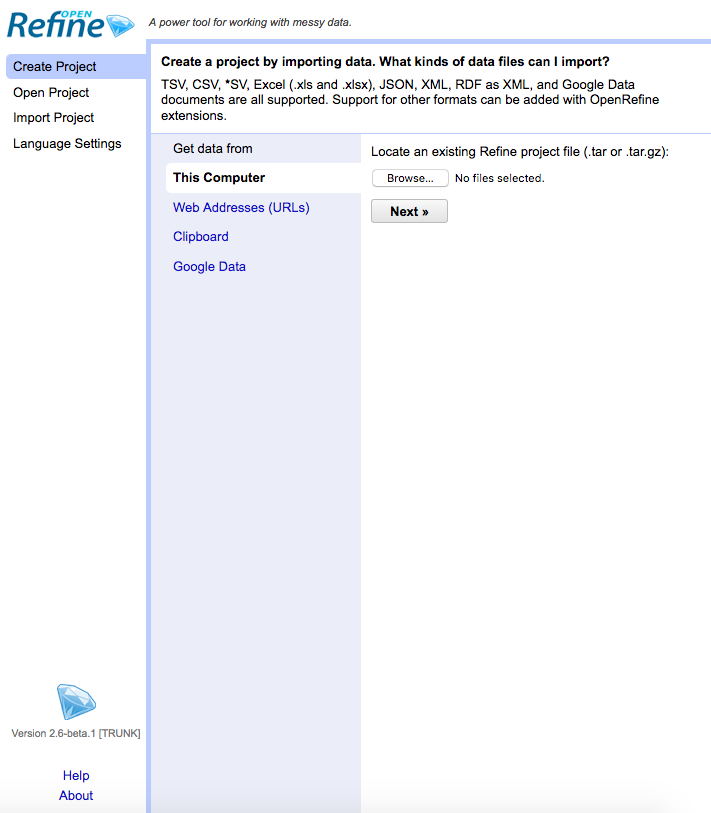
Step 2: Open OpenRefine. It should open a new browser window, but if it does not, open a new window, put http://127.0.0.1:3333/ in the navigation bar and hit enter. You will see a screen like this:
Step 3: Upload your data. You can either do this by uploading an .xls or .csv file, or by clicking on Google Data and importing directly from a public Google spreadsheet or fusion table. If you take the latter path, make sure (1) the document is public (instructions here) and (2) that this downloads the data from google. Changes you make in OpenRefine will not be reflected in the original.
(If you are new to OpenRefine, I would recommend first entering all of your data into an Excel, Google sheet, or Fusion table, then downloading that as a .csv file, and then uploading that to OpenRefine to avoid confusion)
Once you have identified your data source, click Next. As a default, OpenRefine will read the first line of your file as the name of columns. Make sure that the “Quotation marks are used to enclose cells containing column separators” checkbox is unselected. Click Create Project.
Step 4: OpenRefine creates Remove duplicates. First, we want to make sure that there are no duplicates in your dataset. You can sort by a feature of your data that should be unique for each record (ideally, this should be a letter or number combination, not a textual descriptor). Sort the dataset by this column (click the triangle next to the column title, select sort, then select numbers. Click ok). A sort menu should have appeared at the top of the screen. Select it, and then select Reorder rows permanently.
From the Programming Historian:
Identical rows are now adjacent to each other. Next, blank the Record ID of rows that have the same Record ID as the row above them, marking them duplicates. To do this, click on the Record ID triangle, choose Edit cells > Blank down. Eliminate those rows by creating a facet on ‘blank cells’ in the Record ID column (‘Facet’ > ‘Customized facets’ > ‘Facet by blank’), selecting the 84 blank rows by clicking on ‘true’, and removing them using the ‘All’ triangle (‘Edit rows’ > ‘Remove all matching rows’).
Be aware that special caution is needed when eliminating duplicates. In the above mentioned step, we assume the dataset has a field with unique values, indicating that the entire row represents a duplicate. This is not necessarily the case, and great caution should be taken to manually verify whether the entire row represents a duplicate or not.
Step 5: Explore your data. Each column has an arrow next to it with a number of options.
Use the Facet option to view a list of categories in the left hand sidebar, and click on each category to see the records associated with it. This might allow you to see that you have two categories that represent the same information (i.e. New York vs. N.Y.) and that you will have to systematize them.
Use the Cluster option to bulk edit similar categories. For each column that you are concerned about, use the Edit Cells > Cluster and edit option. It will show you terms from that column that are similar (i.e. Michael and Micheal) and allow you to make them uniform. Select Merge Selected and Recluster. 
This is a great way to check for typos, but should be reserved for columns that contain relatively short strings of words. This is not for paragraphs of text.
Step 6: Once you are done cleaning (or just done with your session) make sure to export your data, using the Export menu at the top right of the screen.